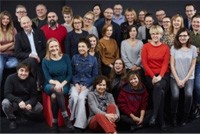
The share of men and women in total number of employees of Agora Group and its entities is similar, with minor deviations. Diversity in Agora Group is also visible in the age structure that roughly reflects the age structure of Polish population. Changes in employment structure between 2017 and 2018 were minimal.
Tab. Employment in Agora Group and its largest entities by age and gender
Employment in agora group and its largest entities by age and gender - 2018
| Age | Agora Group | Agora S.A. | AMS S.A. | Helios S.A. |
Radio Agora Group |
|
|---|---|---|---|---|---|---|
 Women
Women
|
< 30 | 17.1% | 15.9% | 5.1% | 25.6% | 10.5% |
| 30-50 | 70.9% | 68.6% | 78.6% | 69.7% | 86.0% | |
| >50 | 12.0% | 15.5% | 16.3% | 4.6% | 3.5% | |
 Men
Men
|
< 30 | 13.7% | 11.4% | 2.7% | 25.3% | 15.2% |
| 30-50 | 72.6% | 72.7% | 68.0% | 66.9% | 81.8% | |
| >50 | 13.7% | 16.0% | 29.3% | 7.9% | 3.0% | |
 In all
|
< 30 | 15.5% | 13.8% | 4.0% | 25.5% | 13.0% |
| 30-50 | 71.7% | 70.5% | 74.0% | 68.4% | 83.7% | |
| >50 | 12.8% | 15.7% | 22.0% | 6.2% | 3.3% | |
| Women | 52.9% | 53% | 56.6% | 52.3% | 46.3% | |
| Men | 47.1% | 47.0% | 43.4% | 47.7% | 53.7% |
Source: Human Resources Department, Agora Group.
Employment in agora group and its largest entities by age and gender - 2017
| Age | Agora Group | Agora S.A. | AMS S.A. | Helios S.A. |
Radio Agora Group |
|
|---|---|---|---|---|---|---|
 Women
Women
|
< 30 | 18.8% | 17.5% | 5.1% | 27.3% | 16.1% |
| 30-50 | 70.4% | 68.7% | 80.6% | 68.7% | 82.1% | |
| >50 | 10.8% | 13.8% | 14.3% | 4.0% | 1.8% | |
 Men
Men
|
< 30 | 15.6% | 12.5% | 3.7% | 34.3% | 18.2% |
| 30-50 | 71.0% | 71.5% | 72.8% | 58.4% | 77.3% | |
| >50 | 13.4% | 16.0% | 23.5% | 7.3% | 4.5% | |
 In all
|
< 30 | 17.3% | 15.1% | 4.5% | 30.8% | 17.2% |
| 30-50 | 70.6% | 70.1% | 77.1% | 63.6% | 79.5% | |
| >50 | 12.1% | 14.8% | 18.4% | 5.6% | 3.3% | |
| Women | 51.7% | 52.2% | 52.2% | 49.7% | 45.9% | |
| Men | 48.3% | 47.8% | 47.8% | 50.3% | 54.1% |
Source: Human Resources Department, Agora Group.
Employment structure by gender and region is similar to general structure of Agora’s workforce. The differences in some regions (Wielkopolskie, Łódzkie, Śląskie) are caused by the fact that some male-dominated departments such as IT, technical and printing divisions are located in those regions. The highest number, over a half of all employees of Agora Group, is employed in Mazowieckie region. Large groups are also based in Śląskie, Wielkopolskie and Zachodnipomorskie.
Tab. Employment in Agora Group by gender and region
Employment structure by type of contract, employment model, and gender - 2018
| Agora Group | Agora S.A. | |||
|---|---|---|---|---|
| Region |
 Women
Women
|
 Men
Men
|
 Women
Women
|
 Men
Men
|
| dolnośląskie | 58.6% | 41.4% | 69.2% | 30.8% |
| kujawsko - pomorskie | 59.2% | 40.8% | 59.3% | 40.7% |
| lubelskie | 55.6% | 44.4% | 0.0% | 100.0% |
| lubuskie | 46.2% | 53.8% | 45.5% | 54.5% |
| łódzkie | 63.6% | 36.4% | 52.9% | 47.1% |
| małopolskie | 59.5% | 40.5% | 52.8% | 47.2% |
| mazowieckie | 56.7% | 43.3% | 56.7% | 43.3% |
| opolskie | 59.1% | 40.9% | 57.1% | 42.9% |
| podkarpackie | 45.0% | 55.0% | 66.7% | 33.3% |
| podlaskie | 53.1% | 46.9% | 50.0% | 50.0% |
| pomorskie | 57.6% | 42.4% | 53.1% | 46.9% |
| śląskie | 36.7% | 63.3% | 48.6% | 51.4% |
| świętokrzyskie | 54.8% | 45.2% | 38.5% | 61.5% |
| warmińsko - mazurskie | 26.7% | 73.3% | 28.6% | 71.4% |
| wielkopolskie | 28,3% | 71,7% | 22,3% | 77,7% |
| zachodniopomorskie | 56.8% | 43.2% | 62.5% | 37.5% |
Source: Human Resources Department, Agora Group.
Employment structure by type of contract, employment model, and gender - 2017 rok
| Agora Group | Agora S.A. | |||
|---|---|---|---|---|
| Region |
 Women
Women
|
 Men
Men
|
 Women
Women
|
 Men
Men
|
| dolnośląskie | 58.7% | 41.3% | 70.2% | 29.8% |
| kujawsko - pomorskie | 61.1% | 38.9% | 60.7% | 39.3% |
| lubelskie | 50.0% | 50.0% | 0.0% | 100.0% |
| lubuskie | 48.1% | 51.9% | 47.8% | 52.2% |
| łódzkie | 63.6% | 36.4% | 56.6% | 43.4% |
| małopolskie | 59.7% | 40.3% | 55.0% | 45.0% |
| mazowieckie | 55.0% | 45.0% | 55.0% | 45.0% |
| opolskie | 54.2% | 45.8% | 50.0% | 50.0% |
| podkarpackie | 43.3% | 56.7% | 66.7% | 33.3% |
| podlaskie | 53.1% | 46.9% | 58.3% | 41.7% |
| pomorskie | 55.8% | 44.2% | 51.4% | 48.6% |
| śląskie | 36.1% | 63.9% | 52.5% | 47.5% |
| świętokrzyskie | 54.8% | 45.2% | 41.7% | 58.3% |
| warmińsko - mazurskie | 25.0% | 75.0% | 28.6% | 71.4% |
| wielkopolskie | 27.5% | 72.5% | 21.4% | 78.6% |
| zachodniopomorskie | 58.7% | 41.3% | 64.7% | 35.3% |
A vast majority of the employees have permanent contracts and work full time. Part-time employment is twice more frequent among women and is caused by balancing professional and family duties.
Tab. Employment structure by type of contract, employment model, and gender
Struktura zatrudnienia ze względu na rodzaj i typ umowy, w podziale na płeć - 2018
| Agora Group | Agora S.A. | |||||
|---|---|---|---|---|---|---|
 Women
Women
|
 Men
Men
|
 Total
Total
|
 Women
Women
|
 Men
Men
|
 Total
Total
|
|
| Type of contract | ||||||
| trial | 2.2% | 1.4% | 1.8% | 1.5% | 0.6% | 1.1% |
| fixed term | 8.5% | 6.2% | 7.4% | 7.7% | 4.5% | 6.2% |
| permanent | 87.6% | 91.6% | 89.5% | 89.7% | 94.4% | 91.9% |
| substitute | 1.7% | 0.8% | 1.3% | 1.0% | 0.5% | 0.8% |
| Full time vs. part time | ||||||
| full time | 96.3% | 97.1% | 96.7% | 95.8% | 96.9% | 96.3% |
| part time | 3.7% | 2.9% | 3.3% | 4.2% | 3.1% | 3.7% |
Source: Human Resources Department, Agora Group.
Struktura zatrudnienia ze względu na rodzaj i typ umowy, w podziale na płeć - 2017
| Agora Group | Agora S.A. | |||||
|---|---|---|---|---|---|---|
 Women
Women
|
 Men
Men
|
 Total
Total
|
 Women
Women
|
 Men
Men
|
 Total
Total
|
|
| Type of contract | ||||||
| trial | 1.4% | 1.7% | 1.6% | 1.1% | 0.9% | 1.0% |
| fixed term | 10.4% | 8.2% | 9.3% | 9.5% | 6.1% | 7.9% |
| permanent | 86.0% | 89.1% | 87.5% | 88.1% | 92.1% | 90.0% |
| substitute | 2.2% | 1.0% | 1.6% | 1.3% | 0.9% | 1.1% |
| Full time vs. part time | ||||||
| full time | 96.3% | 98.5% | 97.4% | 96.1% | 98.2% | 97.1% |
| part time | 3.7% | 1.5% | 2.6% | 3.9% | 1.8% | 2.9% |
Source: Human Resources Department, Agora Group.


